Validating against Kim et al. (2024)
What Fig. 13a actually reports
Kim et al.'s Fig. 13a reports two shear-stress quantities per rocking frequency, both taken as a max over one period in the quasi-steady regime — deliberately excluding the startup transient, not a global max over the whole run:
- τ_liq_max (solid circles) — the absolute max of shear stress over space and time.
- τ_liq_mean (hollow circles) — the max over time of the
spatially-averaged shear stress (i.e.
max_t ⟨τ(t)⟩_space, not a mean over time).
This project's direct analogs are tau_100_max and tau_mean_max in
results.json (see Output files reference),
both restricted to the same quasi-steady window — see
Non-dimensionalization for how the physical
unit conversion works, and
Checkpoint restart and warm-start chains for how
that window is currently defined and its blind spot in multi-segment chains.
Where we actually stand
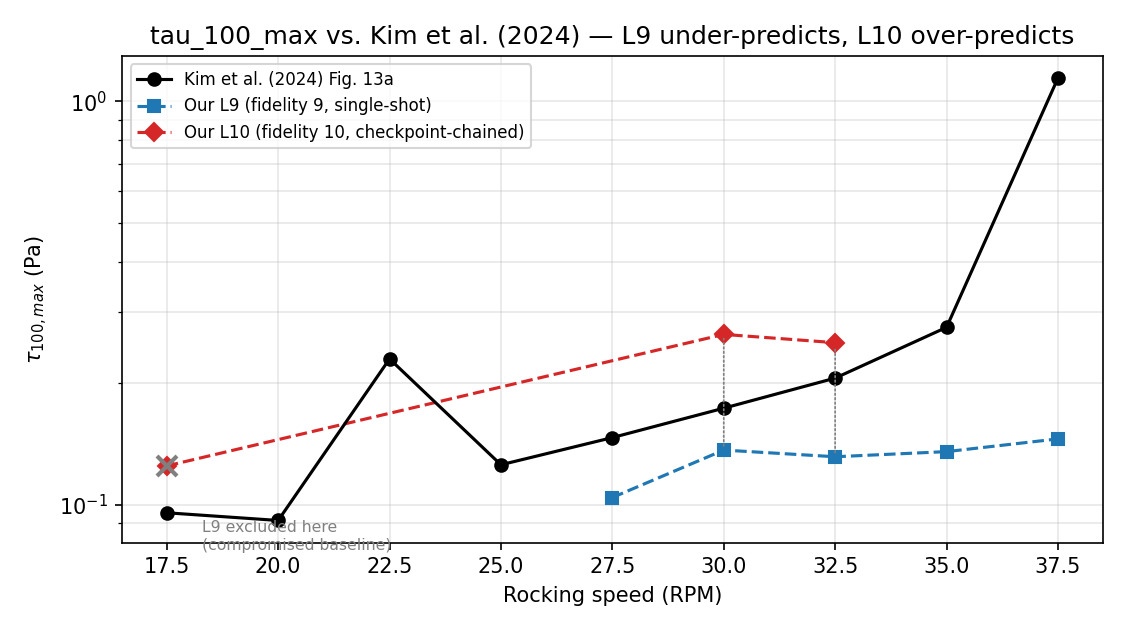
This is written straight, not smoothed over: as of this writing, neither our L9 nor L10 sweep reproduces Kim et al.'s reported values within any reasonable tolerance, and the discrepancy doesn't even have a consistent sign.
17.5 RPM L9 data was found compromised while writing this page — excluded
44133566 (17.5 RPM's L9 run) was the pilot for an abandoned
cross-condition warm-start rerun plan from earlier in this project's
history. Its params.json shows t_checkpoint=18.85,
omega_b_prev=2.356194 (22.5 RPM's own frequency) — it was actually
re-executed as a warm-start from 22.5 RPM's checkpoint, which truncated
and overwrote its original cold-start shear_stress.dat
(fopen(..., "w") on every invocation). The genuine cold-start raw data
for this condition no longer exists. Every other L9 condition used
below was individually re-verified clean (t_checkpoint=None,
shear_stress.dat starting at t=0) before being trusted — this one
wasn't caught until Checkpoint restart and warm-start chains's
isolation experiment needed a clean 17.5 RPM baseline and didn't have
one. The isolation experiment has been redone on 30.0 RPM instead,
which passed the same verification.
L9 (fidelity 9, single monolithic run per condition — no checkpoint
restart of any kind, cold-started, run straight to t_end=18.243),
re-postprocessed with the current code and verified against each
condition's own raw shear_stress.dat:
| RPM | tau_100_max error vs. Kim |
tau_mean_max error vs. Kim |
|---|---|---|
| 17.5 | (data compromised — see above) | (data compromised — see above) |
| 27.5 | −28.9% | −39.9% |
| 30.0 | −21.3% | −37.4% |
| 32.5 | −36.2% | −43.7% |
| 35.0 | −50.8% | −50.7% |
| 37.5 | −87.2% | −62.3% |
Under-prediction, worsening at higher RPM, for both metrics. (20.0 and 25.0
RPM have no recoverable raw data; the 22.5 RPM value that once looked
promising — tau_100_max=0.2376, ~+3.4% — was traced to a rsync
race condition in the SLURM template and is not reproducible from its own
raw data. It's excluded here, not because it's inconvenient, but because
it's been directly falsified.)
L10 (fidelity 10, same condition chained across 3–4 same-omega_b segments, same total duration, final segment only), same code — this data is unaffected by the L9 contamination above (different run_ids entirely):
| RPM | tau_100_max error vs. Kim |
tau_mean_max error vs. Kim |
|---|---|---|
| 17.5 | +30.7% | −35.8% |
| 30.0 | +52.4% | −42.4% |
| 32.5 | +22.4% | −46.9% |
The part that "smells"
Going from L9 to L10 should mean only a mesh refinement — same total
simulated duration, same physical condition, higher resolution. Instead, at
the two conditions with a verified-clean L9 baseline (30.0 and 32.5 RPM),
tau_100_max flips sign: L9 under-predicts, L10 over-predicts.
tau_mean_max doesn't flip sign, but does get somewhat worse. A genuine
mesh refinement shouldn't do this on its own.
Ruled out already, with real experiments, not assumption:
- Stale-metric-definition mismatch (comparing an old whole-run-max
tau_100_maxagainst a new QSS-window-restricted one) — L9 was re-postprocessed with the exact same current code as L10, so this isn't a bookkeeping artifact. - Simple run-to-run nondeterminism — the same environment, rerun identically 3×, always gives the same result.
- Basilisk source-version difference between the persistent OSCAR build and a fresh tarball build — a fresh build still reproduces L9's result.
- Same-condition checkpoint restart itself — tested properly on 30.0
RPM, against a baseline verified clean before use (a first attempt on
17.5 RPM used a baseline later discovered to be corrupted; that result
was retracted, not reported here). Result:
tau_100_maxmoved by only −3.0%,tau_mean_maxby −2.6% — both small, neither anywhere near enough to explain L9 under-predicting Kim by 20%+ while L10 over-predicts by 20-50% at the same conditions. See Checkpoint restart and warm-start chains for the full numbers.
None of the above identifies what explains the sign flip — those three only narrow what's been ruled out. A separate, direct test of the mesh-fidelity change itself did find real evidence, though:
- Mesh-fidelity change (9 → 10), tested directly — two cold-start,
non-chained, single-segment runs at 30.0 RPM, one at each fidelity,
each truncated to the same short window just past the ramp
(t=[6.0, 8.5], about 1.25 rocking periods —
experiments/l9_l10_short_window_test_30rpm/).tau_100_maxmore than doubled between fidelity 9 (0.1367) and fidelity 10 (0.2902), a +112% increase, with no chaining and no long-time integration involved at all.tau_mean_maxmoved only slightly (−5.3%), consistent with that metric not flipping sign in the full-duration data. This is real, direct evidence that the mesh-fidelity change itself is a fast, resolution-intrinsic driver of thetau_100_maxdiscrepancy — not merely an untested candidate anymore.
This doesn't yet say why refining the mesh has this effect (e.g. whether fidelity 9 under-resolves a boundary-layer peak that fidelity 10 correctly resolves, or whether fidelity 10 is resolving a spurious sharp transient that a coarser mesh smooths away) — that mechanism is still an open question. But the sign-flip's proximate cause — resolution, not checkpointing, not something else specific to L10's pipeline — is no longer speculative.
Is fidelity 10 itself converged, though? Kim et al.'s own
grid-convergence appendix (experiments/kimetal2024/Figures/Fig_append1.pdf)
checks velocity, not shear stress, and shows velocity is already
converged by n_L=2^10 — their 2^10 and 2^11 curves overlap, so their
choice of that resolution for the production sweep is legitimate, not
under-resolved. But τ involves a spatial derivative of velocity, which
converges far more slowly than the velocity field itself, and Kim et al.
never checked τ's convergence at all. We checked it cheaply — by reusing
existing raw data instead of running an infeasible fidelity-11 job
(cost scaling from fidelity 9→10 was ~7-9× per level, so fidelity 11
would cost roughly 2-3 weeks):
| Fidelity | n_L |
tau_100_max |
tau_mean_max |
|---|---|---|---|
| 7 (existing run, free) | 128 | 0.0417 | 0.001065 |
| 9 | 512 | 0.1367 (+228%) | 0.001008 (−5%) |
| 10 | 1024 | 0.2902 (+112%) | 0.000955 (−5%) |
| Kim et al. | — | 0.1735 | 0.001611 |
tau_100_max is not converging — it more than doubles at every step
tested, crossing straight through Kim's value rather than approaching it.
It cannot be trusted as validated at any fidelity tested so far, not
just at L9 vs L10 specifically. tau_mean_max, by contrast, is already
flat across this same 8× resolution range (~5% total drift, f7→f10) while
still sitting 35-65% below Kim's value the whole time — proof that its
gap is not a resolution problem. Something else, still unidentified,
explains tau_mean_max's persistent gap.
Why tau_100_max specifically is untrustworthy: it isn't sampling a heavy tail, it's sampling one degenerate cell
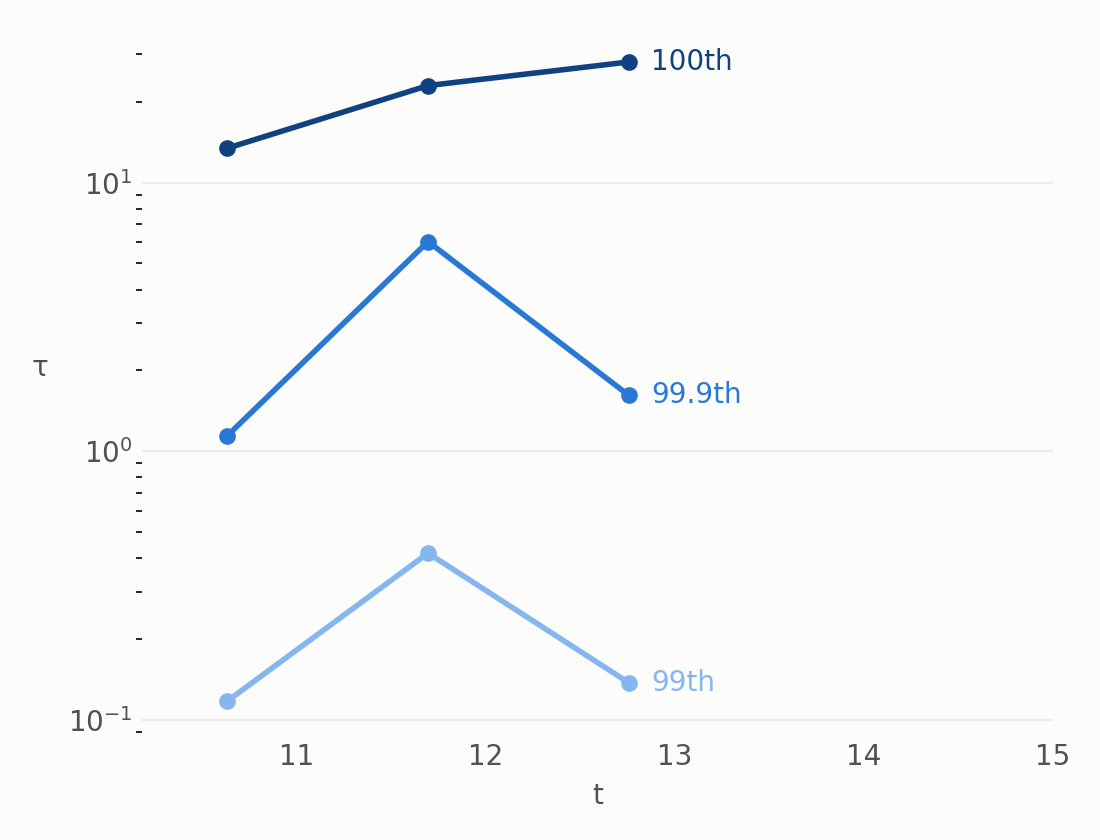
Three real settled-state points from upstream's own driver, computed
from raw per-cell velocity dumps with the same naive stencil used
throughout this doc. No new compute: upstream's OUT_FILES (a
pre-existing feature of Kim et al.'s driver, unrelated to this
comparison) happened to dump full-field snapshots throughout its entire
L10 run "for free"; three of those land after its own ~16.25-cycle ramp
(t=10.63, 11.70, 12.76). Our own fork's L10 run has no equivalent
periodic dump, only the single snapshot (t=12.15) used in the bulk
comparison above — extending it would cost the same per-step price as
any other L10 continuation, hours not free, so it's given as a table
instead of a fabricated fourth line:
| percentile | ours (t=12.15) | upstream (t=10.63 / 11.70 / 12.76) |
|---|---|---|
| 99th | 0.202 | 0.117 / 0.417 / 0.137 |
| 99.9th | 2.29 | 1.14 / 6.03 / 1.61 |
| 100th (max) | 96.0 | 13.4 / 23.0 / 28.1 |
Both codebases show the same qualitative blowup, at every sampled
instant, not just one — three clean, non-overlapping bands (99th <<
99.9th << 100th), each roughly an order of magnitude apart, holding
consistently across all three upstream time points despite the
tau_100-style volatility documented above. A genuinely heavy-but-smooth
tail would grow steadily across all three percentiles; this pattern is
the signature of the 100th percentile
being dominated by a single (or a handful of) degenerate cut cell(s) at
the embedded boundary, where a plain central-difference gradient can
produce an arbitrarily large spurious value as the cut cell's area
shrinks toward zero. Since the SAME uncorrected stencil is used in Kim
et al.'s own bio_stress.m postprocessing, this is evidence the
singularity is a property of the naive stencil near any embedded
boundary, not a fork-specific bug — though at the one instant where both
codebases were sampled together (t≈12.15, the settled-vs-settled bulk
comparison above), ours ran consistently higher (1.36x at the 99th,
1.53x at the 99.9th, 3.91x at the max — a gap that grows the further
into the tail you look), an open, unexplained asymmetry worth chasing
separately. This also explains why tau_100_max
gets worse, not better, with resolution in the table above: finer
grids produce smaller, more pathological cell fragments, not a better-
resolved wall gradient. See diary.md 2026-08-17 for the full derivation,
including a direct restart-sensitivity check (13.7% shift in tau_100
from a single dump/restore cycle, vs. 0.29% for tau_mean at the same
instant) that independently points at the same conclusion: tau_100 is
exposed to a single-cell artifact that volume-averaging protects
tau_mean from.
What this means if you're using these numbers
Don't treat either sweep's tau_100_max/tau_mean_max as validated against
Kim et al. yet. If you need a shear-stress KPI for a real decision today,
prefer tau_98_qss/tau_100_qss (the median-over-QSS-window metrics,
robust to a single transient spike) over the _max variants — the _max
variants are the ones with an unresolved, condition-flipping discrepancy.